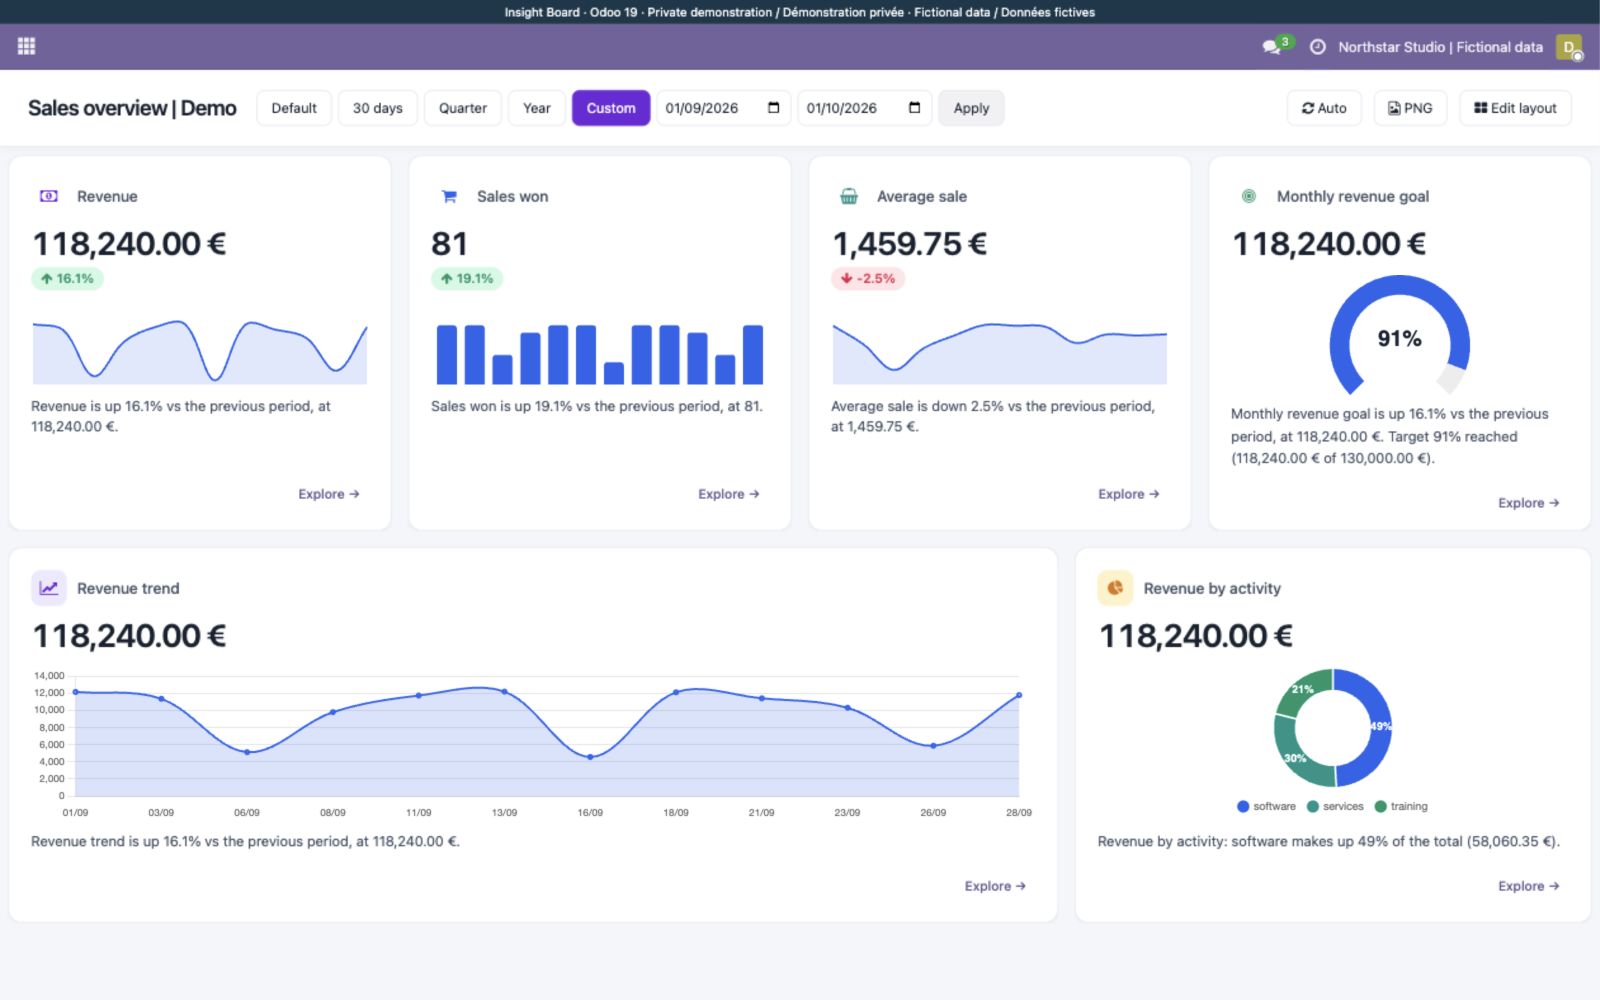
See growth, volume and targets together
Revenue rises while average sale value falls: see the difference alongside your target and activity mix. Actual Odoo 19 private demo with fictional sales for September 2026.
 Insight Board
Explore the module through annotated Odoo screenshots with demonstration data. This is a guided presentation, not a live demo.
Revenue rises while average sale value falls: see the difference alongside your target and activity mix. Actual Odoo 19 private demo with fictional sales for September 2026.
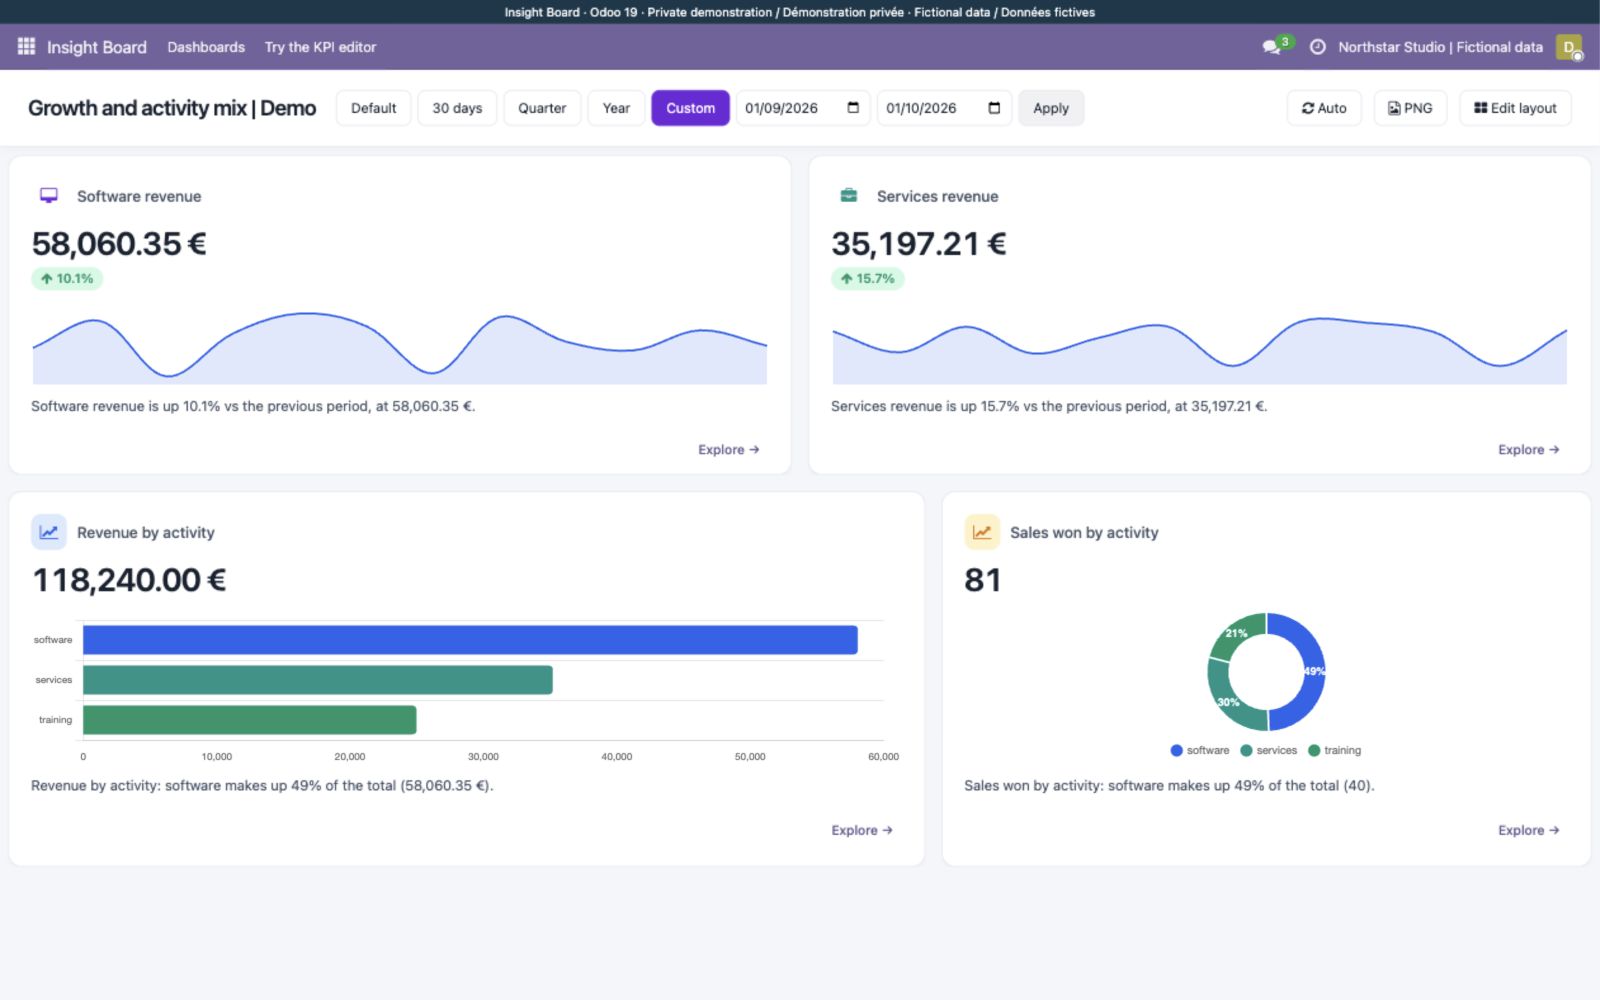
Compare software and services revenue, then examine each activity’s share of revenue and sales volume.
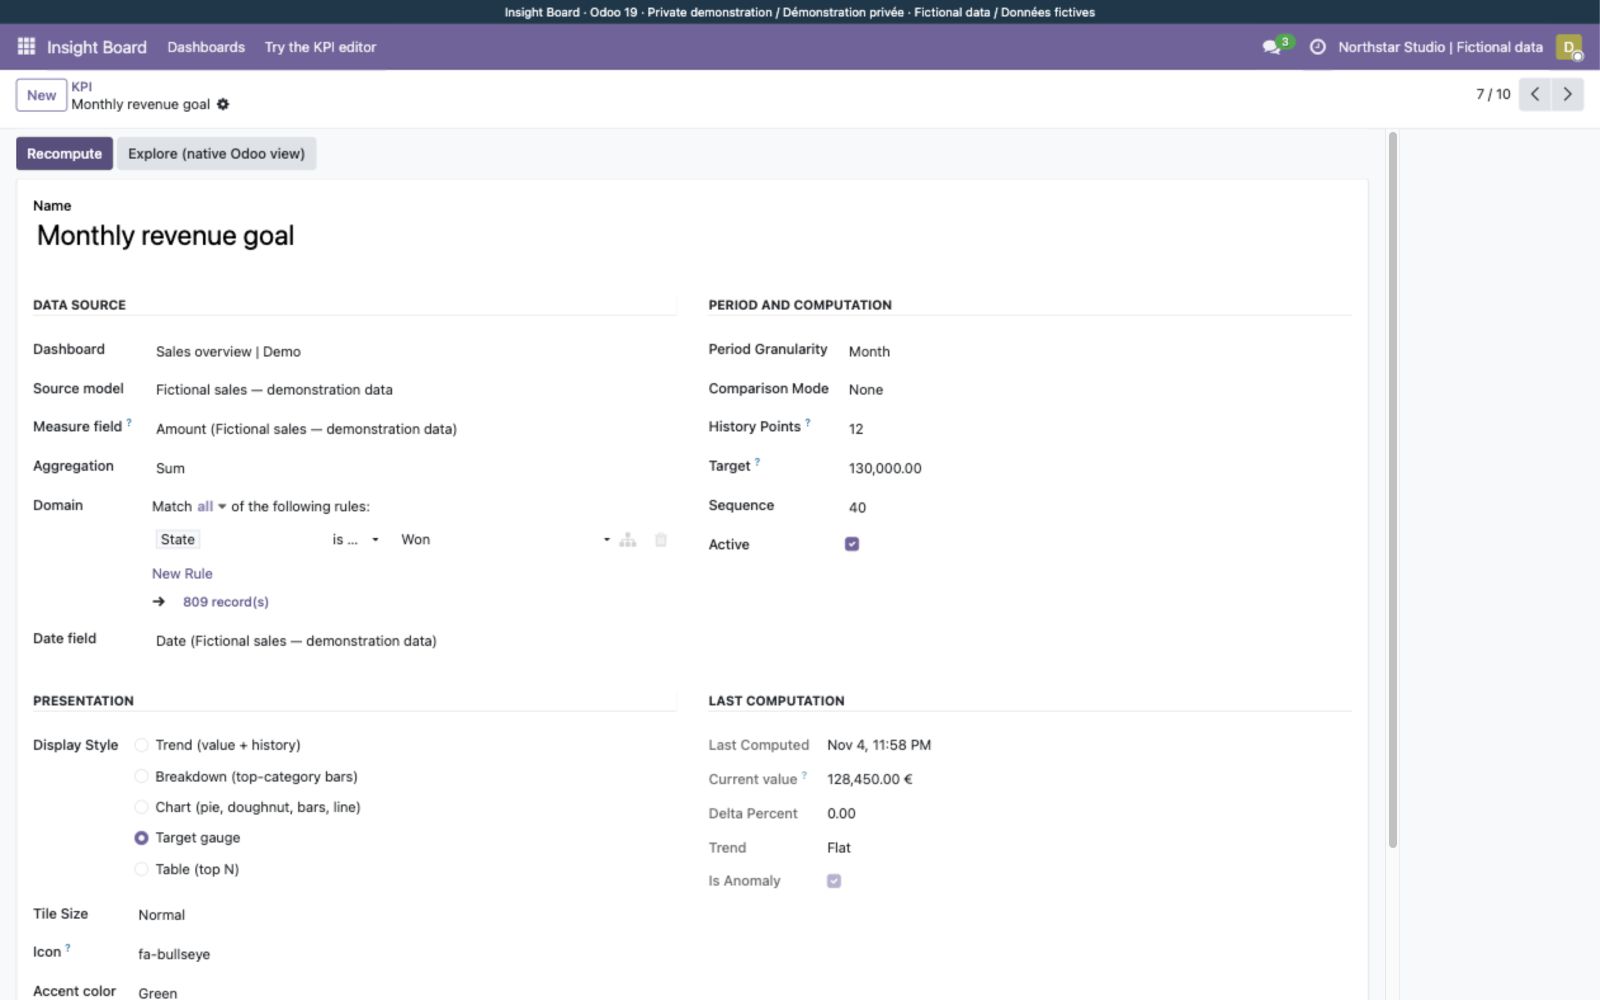
Choose the source, measure, filter, period, target and display style. The private demo uses a restricted fictional-sales source; production sources depend on your installed apps and permissions.